Bill's Weather Station - Little Silver, NJ Weather
Weather Charts
Climate Charts
Scatter Charts
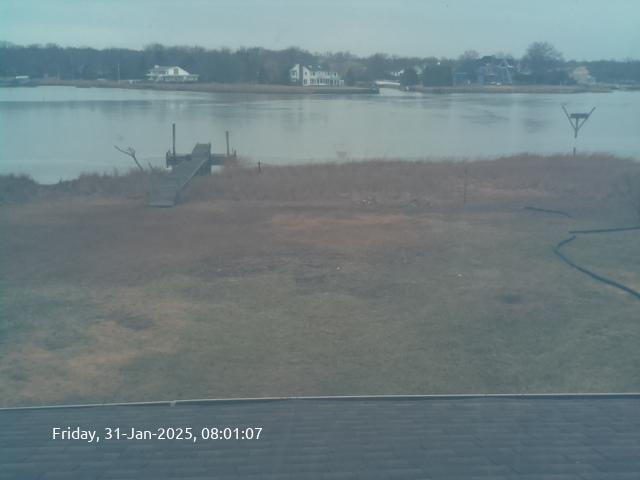
Weather Cam
Links
Description
Factoids
Change Log
Contact
Latest Observations: 2026-08-02 16:00:05
29.91 ↓
| Observation | Value |
|---|---|
| Outside: | 85.78° F |
| Inside: | 85.44° F |
| Barometer: | 29.91 inHg ↓ |
| Humidity Inside: | 66% |
| Illumination: | 81 Lux |
| Exp Temp: | 61.3625° F at 2023-03-09 01:37:47 |
| Heating Zones: | None active |
| Zone Summary Past 24 Hours: | ERROR: exec() failed |
Recent Observations:
Weather Charts
Climate Charts
Bivariate Scatter Charts
Weather Camera and Videos
Today's Stills
Show today's stills. Click on thumbnail for original size.Links
Observations Sent To
- Wunderground KNJLITTL12 Includes just observations. Camera support was discontinued some time ago.
- Windy pws-f05dc6db Includes observations and a short loop taken from the webcam.
- OpenWeatherMap WRW PWS - Experimental, digests data but does not show individual personal stations.
Random
- Hurricane Sandy at the weather station
- More of Sandy at the station
- Osprey Camera - Not weather but from the same location.
- Station Status - Mostly for developer use.
Description
Introduction
This is a simple weather station recording temperature, humidity, barometric pressure, gas consumption, illumination, and images. It consists of two Raspberry Pis with logging software written in Python and the following sensors:
- DS18B20 temperature sensors, 1-wire interface
- Bosch BME280 baro and humidity sensor, i2c interface
- TSL2561 illumination sensor, i2c interface
- RTL-SDR radio receiver for gas consumption
- Raspberry Pi camera for area photos and videos
Weather observations and images are sent to the cloud-based server hosting this site and to Wunderground, where they are displayed on the WunderMap. The RPis are used only for data capture and transmission to the server. The measurement data is stored only in databases in the cloud server, not on the RPi. The temperature sensors include:
- Inside - About 10" off an outside wall which is adjacent to a window. Radiator several feet away.
- Outside - Clamped to window trim on the north side of the house. Subject to solar gain in mornings between the start of spring and the start of fall when the sun rises and sets north of the east-west line.
Station Data
- Location: Little Silver, NJ
- Lat/Lon: 40.33762n, 74.01879w
- Sensor Elevation: 25'
- Wunderground Station ID: KNJLITTL12
- Wunderground Station Name: Little Silver Point
Weather Camera and Videos
A Raspberry Pi camera captures stills at one-minute intervals throughtout daylight hours, give or take, which are combined into stop-motion videos just after midnight. At 24 frames/second the video is 1440 times faster than real time. That is, twelve hours of real time is compressed into a 30-second video.
The calendar above shows dates for which videos are available. Click on Show to see the video. Older videos are purged aperiodically to conserve storage space so the available videos will change from time to time.
The camera is mounted inside and shoots through two panes of glass in colder months and one in warmer months. The panes are not optical glass and the inside one is old wavy glass. The wavy glass, four air/glass surfaces, and some soil on the glass all contribute to reduced image quality.
High-Resolution Stills
High-res stills are no longer supported. The Nikon D70 capturing the high-res still images was damaged by a close lightning strike about 8:00 PM on 7 Aug 2018 and has not been replaced.
Static Temperature Charts
These graphs show data current as of the past midnight and load much faster than the dynamic ones. The current week is generated daily just before midnight. The Current week static graph together with the Last 24 hours dynamic graph covers the current week to now.
Dynamic Temperature Charts
These graphs show data up the the present. They require a bit of patience proportional to the length of the graph and can take several seconds as they are generated on demand.
Climatological Data
The climatological data includes temperature averages, lows, highs and degree-days by year, month and day in tabular form and averages, lows, and highs for every day in the year by year in graphical form.
The highs and averages shown during the spring and summer, that is from the vernal equinox to the fall equinox, are higher than actual because the outside temperature sensor is exposed to direct solar radiation early in the morning and late in the evening. The outside wall with the sensor is aligned nearly perfectly with the Earth's east-west axis such that the solar gain is symmectric in morning and evening. This can be seen by the brief peaks at morning and evening in temperature graphs during the spring and summer months. Someday I'll add a radiation shield.
Gas Consumption
I am interested in recording natural gas consumption with the thought that the data would help identify thermal parameters of my home, areas to improve thermal behavior, and provide feedback for changes. I hope to correlate gas usage with meteorological parameters including temperature and wind. Many years ago and in a different home I made daily recordings by hand of the gas meter during one heating season. That data showed clearly the benefits of keeping the door between the basement and the first floor closed. I'm no longer up for manual recording and daily readings lack sufficient resolution for the usage I want to study and so I looked for an automatic solution.
It turns out that my gas company reads the meter from a vehicle on the street. If they can read it I though I could as well. The technology of Automatic Meter Reading (AMR) is well described online and others have already developed both open-source and proprietery products for this using software-defined-radio concepts. It was a simple matter to glue a few existing parts together to receive the broadcasts from the meter and then write a little software to record and display it.
My gas meter, an Itron 100G DLT, periodically broadcasts Standard Consumption Messages (SCM) in bubble-up mode, a peculiar term that means it broadcasts spontaneously, not on demand from a reader. The messages are received with a RTL-SDR dongle (an inexpensive DVB-T receiver containing a Realtek RTL2832U demodulator and R820T tuner) connected to a Raspberry Pi 2 B+. The RPi runs a program known as RTLAMR (written by Douglas Hall and generously contributed to the open-source community) to decode the meter signal and convert it to JSON text. A Python program reads the output from RTLAMR and send it to the cloud server for storage and presentation. The processor load on the RPi 2 B+ is 100%. It appears to drop some packets but works well enough to provide the meter readings at an adequate sampling rate, typically once every few minutes. The capture process is stochastic in nature because of intereference from other meters in the neighborhood and the frequency-hopping nature of the transmissions.
The graphs linked in the following table explores the option space of graph period, histogram bucket size, and measurement units. This is experimental to help understand the most useful display formats. The % Max column is specific to my Weil-McLain ECO 155 boiler with a maximum input of 155,000 BTUs/hour. It shows the actual usage as a percentage of the maximum input to the boiler. The cost column includes only components proportional to usage (gas and delivery), excludes the fixed Residental Customer Charge. Note that all of the columns display identical data. The graphs differ only in the units and scale factor of the Y-axis.
User-Interface Design
This site uses modern web technology internally including HTML5, PHP, Javascript, chart, calendar, and date-picker Javascript libraries, Jquery, AJAX, MySql, Python, and more. The user interface is intentionally old school, with none of the distracting elements of modern UI design and with a nod to Edward Tufte.
Future Work
Add more sensors later including wind speed and direction.
Factoids
Barometric Factoids
-
inHg - Inch of Mercury - is a unit of measurement used for barometric
pressure in weather reports in the United States.
It is the pressure exerted by a column of mercury of 1 inch (25.4 mm) in
height at the standard acceleration of gravity. One inHg is 3376.85 Pascals
at 60 degrees F.
-
Pa - Pascal - is a metric (SI) unit of pressure defined as one Newton per Square Meter.
-
hPa - Hectopascal - 100 Pascals, equivalent to one millibar.
-
bar - Bar - is slightly less than the average atmospheric pressure on Earth at sea level
and is defined exactly as 100,000 Pa.
-
mbar - Millibar - one thousandth of a bar, equivalent to 1 hPa.
-
psi - Pounds/sq-in - Is a common unit of pressure measurement though not often in weather.
One psi is 6894.76 Pa, 68.9476 mbar or hPa.
-
Under standard conditions the barometric pressure at sea level is 101,325 Pascal, 1013 mbar (or hPa),
and 30.00 inHg. At 10' the pressure drops by 36.61 Pa, .3661 mbar, and .01081 inHg. At 100' the pressure
drops by 365.63 Pa, 3.6563 mbar, and .1079 inHg. Yes, pressure is non-linear with height.
At the station height of approximately 25' above Mean Sea Level the
pressure drops by 91.50 Pa, .915 mbar, and .02701993 inHg. This value is
added to the barometer readings to normalize the reading to MSL.
Illumination Factoids
-
TSL2561 sensor range: .1 - 40,000 lux
-
120,000 lux Brightest sunlight
-
111,000 lux Bright sunlight
-
20,000 lux Shade illuminated by entire clear blue sky, midday
-
1,000 - 2,000 lux Typical overcast day, midday
-
<200 lux Extreme of thickest storm clouds, midday
-
400 lux Sunrise or sunset on a clear day (ambient illumination)
-
40 lux Fully overcast, sunset/sunrise
-
<1 lux Extreme of thickest storm clouds, sunset/rise
-
<1 lux Moonlight, clear night sky
-
0.25 lux A full Moon, clear night sky
-
0.01 lux A quarter Moon, clear night sky
-
0.002 lux Starlight, clear moonless night sky, including airglow
-
0.0002 lux Starlight, clear moonless night sky, excluding airglow
-
0.00014 lux Venus at brightest, clear night sky
-
0.0001 lux Starlight, overcast moonless night sky
Gas Heating Factoids
-
BTU - the amount of energy needed to heat 1 pound of water 1 degree Farenheit.
-
BTU Content - a number that relates a volume measurement such as cubic feet to an energy
measurement such as BTU. There is a variation in the exact heat content of gas by region and year. This factor
is used to convert the volume measured by gas meters to the heat content of gas for billing. The factor
is typically a few percentage points around 1. A gas bill from 2015 had an exact value of 1.067.
-
CF - a cubic-foot of natural gas contains roughly 1000 BTUs, exactly 1067 BTUs applying the BTU content
above.
-
CCF - 100 cubic feet. A common unit of gas volume for billing. Roughly 1 Therm. Exactly 1.067 therms with the
BTU content from above.
-
Therm - 100,000 BTUs, a common unit of gas energy for billing. Roughly 1 CCF. Exactly
93.72 cubic feet with the BTU content from above.
-
Hot Water - One gallon of water weighs 8.34 pounds. My 40 gallon hot water tank thus requires
333.6 BTUs to heat it 1 degree Farenheit, or 20,016 BTUs to heat it from a cold start from 60 degrees
ambient
to a common working temperature of 120 degrees. The output of my boiler is 143,000 BTUs/hour. At that
rate it should take about 8.5 minutes to heat the tank from a cold start.
A typical low-flow shower head consumes about 2 gallons/minute or 16.68 pounds/minute. It will take
1167 BTUs/minute (70,000 BTUs/hour) to heat that water coming in at 50 degrees to 120 degrees.
Given my boiler output it should be able to supply two showers running continuously without running out of hot water.
Change Log
Update 20-July-2025
Update 20-July-2025
Added playback speed controls on weather cam videos. Slower and Faster modify the current playback speed by a factor of -/+ .2. The remaining controls set the speed relative to the normal frame rate.
Update 22-Jan-2024
Added Heating Zone chart showing the running time of each heating zone circulator. The data is acquired with a simple computer vision system built with ESP-32 Cam. That captures an image of the lights on the Taco zone controller to determine which zones are active. Since the power light is always on it provides a reference from which state of the other zones can be determined. Camera is not stable yet. Will post photos later.
Update 11-Feb-2023
Added a temperature probe identified as Roamer Temperature in the Weather Charts Observation menu. This is an experimental unit built on an ESP8266 micro-processor with a DS18B20 sensor. It is the first of what I expect to be an ensemble of several sensors placed around the house to collect parameters for modeling the thermal performance of individual rooms. With one probe the observations will have gaps and lack continuity between probe locations.
Update 2-Feb-2023
Site finally back up following a failure of the Rpi memory card ages ago. The last gas reading before the failure was at 09:24:01 on 4-Aug-2020. Rebuilt the Rpi with a current OS, installed weather and gas monitoring software and updated it for the current software environment.
As a lot has changed so some initial instability is possible.
Update 26-Apr-2020
Completely removed the Obsolent Links section and supporting files from the site. We have been seeing requests to the supporting files in the server logs even though the linking section was not present on the page. Such requests will now result in an error to the calling client.
Made several internal changes that should not be externally visible.
Update 16-Jan-2020
Moved from period selection tables to drop-down menus for all chart types. Cleaned up user interface interactions regarding custom range selection charts. Moved exploratory charts to fully-supported Bivariate Scatter Charts with independent axis selection.
Update 14-Jan-2020
Added climate charts showing minimum, average, and maximum temperature over specified periods and for one or more years. For performance reasons data for these charts comes from a database created periodically offline, not from the primary meteo database used for weather charts.
A few days earlier added exploratory charts. These currently include a scatter plot comparing temperature to barometric pressure.
Update 8-Jan-2020--
Lots of cleanup and tweaking to get sensible appearance of gas charts, especially over long periods. Added option and feature to include temperature data for selected period from prior year.
Update 1-Jan-2020
Added gas-consumption database to new chart with fixed periods and custom date ranges.
Update 31-Dec-2019
Added adaptive decimation for custom date ranges to limit data size for large ranges. Still tweaking it. Added illumination chart. Changed illumination dial units from log10( Lux ) to Lux. More code cleanup including converting some residuals to jquery.
Update 30-Dec-2019
Added custom date range for charts. Removed remainder of SqLite database use. Added indication in chart of missing data in database with a gray bar spanning the missing interval. It is only shown on the temperature graph. Code cleanup.
Update 28-Dec-2019
Added inline charts of baro, humidity, and illumination. Refactored chart code to remove redundancies that crept in during development. Tweaked chart selection and display UI. MySql database and inline charts made major reduction is render time.
Update 26-Dec-2019
Began migrating observations database from SqLite to MySql. Obs are now recorded in both databases. MySql improves performance and enables or simplifies several features. Added temperature range and baro change using the new database. Added an inline chart of temperature. Prior charts (still included) were all externally generated images.
Update 22-Dec-2019++
Incremental cleanup and styling. Adapted content to screen size by substituting text for dials and changing two columns to one column dynamically.
Update 22-Dec-2019
Finally got around to a major cleanup and reorganization of the site. Replaced video links from a simple list to a calendar. Replaced text current observations with gauges. Moved most interesting items to top. Moved all updates to this change log section. Separated documentation from chart links.
Update Fall-2019
Replaced the baro/humidity sensor fried a year ago with a new one.
Update Spring-2019
Physically removed the fried D70 camera. Added a new Raspberry Pi camera for osprey nest observation. Mounted both on a single platform supported on one tripod.
Update 30 Aug 2018
A lightning strike at about 8:00 PM on 7 Aug 2018 fried the baro/humidity sensor and the D70 camera. Will deal with it someday.
Update 2 May 2018
I finally added a radiation shield to the outside temperature sensor. This should eliminate the little spikes in temperature in the morning and evening on days between the equinoxes when the sensor was getting some direct sunlight.
Update 30 March 2018
I replaced the Bosch BMP280 I2C with a Bosch BME280 I2C, which includes humidity, and now report inside humidity in the latest obs. Added a TSL2561 I2C illumination sensor and now also report illumination in the latest obs. The sensor is near a north-facing window inside the house, not in direct sunlight yet, and reporting in Lux, not Watts/square-meter. Eventually I may log both in the database, make graphs, and move the baro/humidity sensor outside.
Update 31-Jan-2018
Experimenting with capture every minute.
Update 20-Jan-2018
Added a second camera, a Raspberry Pi V2. Exploratory. Presently this captures a 640x480 image every five minutes and uploaded here for display, for videos, and to Wunderground.
Update 17 Jan 2018
I added a Bosch BMP280 I2C pressure and temperature sensor to the station. The barometric readings are stored in the database, displayed in Current Observations and dynamic graphs, and reported to Wunderground. No static barometric graphs yet and possibly never. Humidity is coming. Note, while there is some variance between the barometer readings here and some nearby private weather stations as reported on Wunderground, the elevation-corrected value here agrees with the nearest National Weather Service station - Belmar-Farmingdale (KBLM) - to within a fraction of a percent. The inaccuracy of the other stations may be due to inadequate elevation compensation.